Our optimization study and benchmarks (all numbers are exact solver runs not surrogate prediction)
Norne field · 16 wells · 5 control intervals · 113,344 grid cells
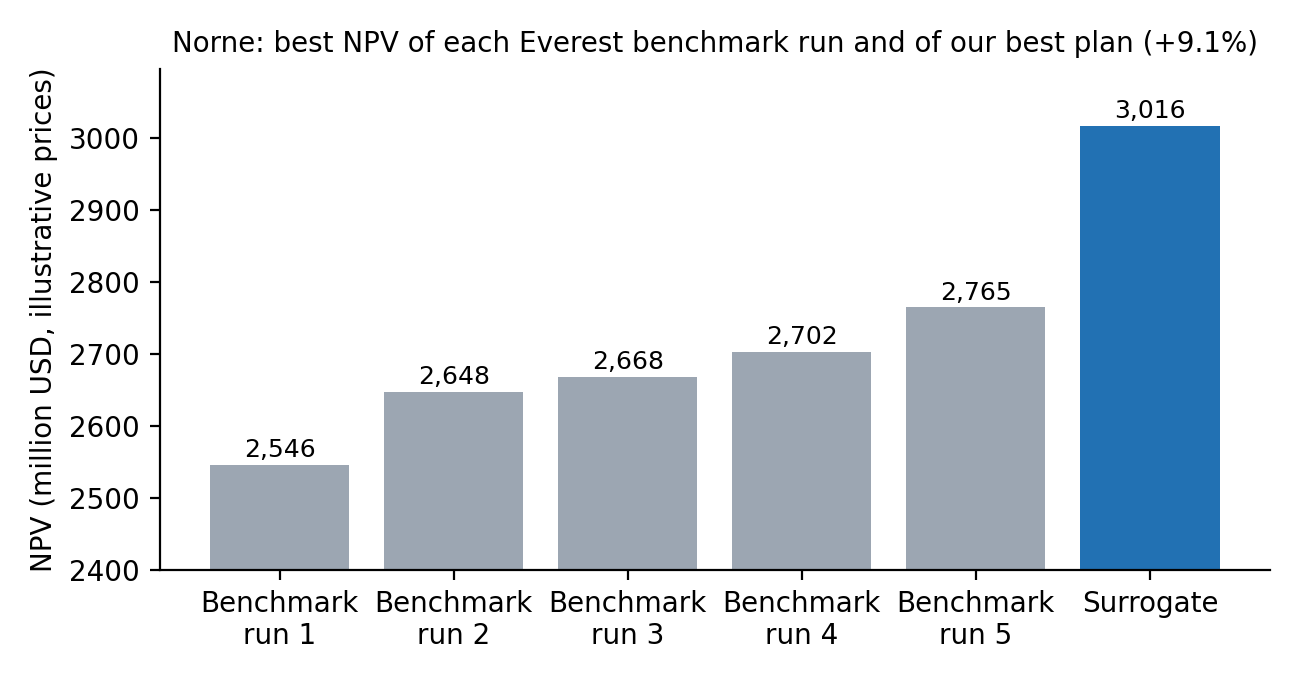
Our best plan
$3016.2M
NPV in OPM Flow, +9.1 % vs Everest
+65.1 % vs base plan (end of history)
Everest's best
$2764.7M
NPV in OPM Flow
Try your plan
Start from one of the plans, change any control, and press Predict.
Units: Minimum BHP in bar · Gas injection rate in Sm³/day · Water injection rate in Sm³/day.
Start from: Best plan foundEverest's bestStart plan of the 188 Flow runs within 3 % of our best NPV
The table has changed. Press Predict to update these results.
| Objective | This plan (surrogate) | Our best plan (validated) | vs our best plan |
|---|---|---|---|
| NPVmillion USD, higher is better | 2,754 ± 30 | 3,016 | -7.6 %, worse |
| Oil producedmillion Sm³, higher is better | 11.04 ± 0.10 | 12.88 | -13.2 %, worse |
| Gas producedbillion Sm³, lower is better | 24.39 ± 0.21 | 33.16 | -25.6 %, better |
| Water producedmillion Sm³, lower is better | 73.85 ± 0.73 | 71.45 | +3.4 %, worse |
| Gas injectedbillion Sm³, lower is better | 18.90 ± 0.13 | 26.84 | -29.6 %, better |
| Water injectedmillion Sm³, lower is better | 64.19 ± 0.53 | 55.36 | +14.7 %, worse |
| Plateaumonths, higher is better | 3.98 ± 0.33 | 0.00 | +0.0 %, better |
| Water breakthroughmonths, higher is better | 23.7 ± 6.2 | 0.0 | -20.5 %, within the error |
| Energy useGWh, lower is better | 2,381 ± 16 | 3,161 | -25.0 %, better |
| Energy per unit of oilkWh per Sm³, lower is better | 214.7 ± 3.2 | 245.4 | -13.2 %, better |
Field rates, month by month
This planOur best planboth predicted