Our optimization study and benchmarks (all numbers are exact solver runs not surrogate prediction)

Norne field · 16 wells · 5 control intervals · 113,344 grid cells

Our best plan $3016.2M NPV in OPM Flow, +9.1 % vs Everest +65.1 % vs base plan (end of history)
Everest's best $2764.7M NPV in OPM Flow
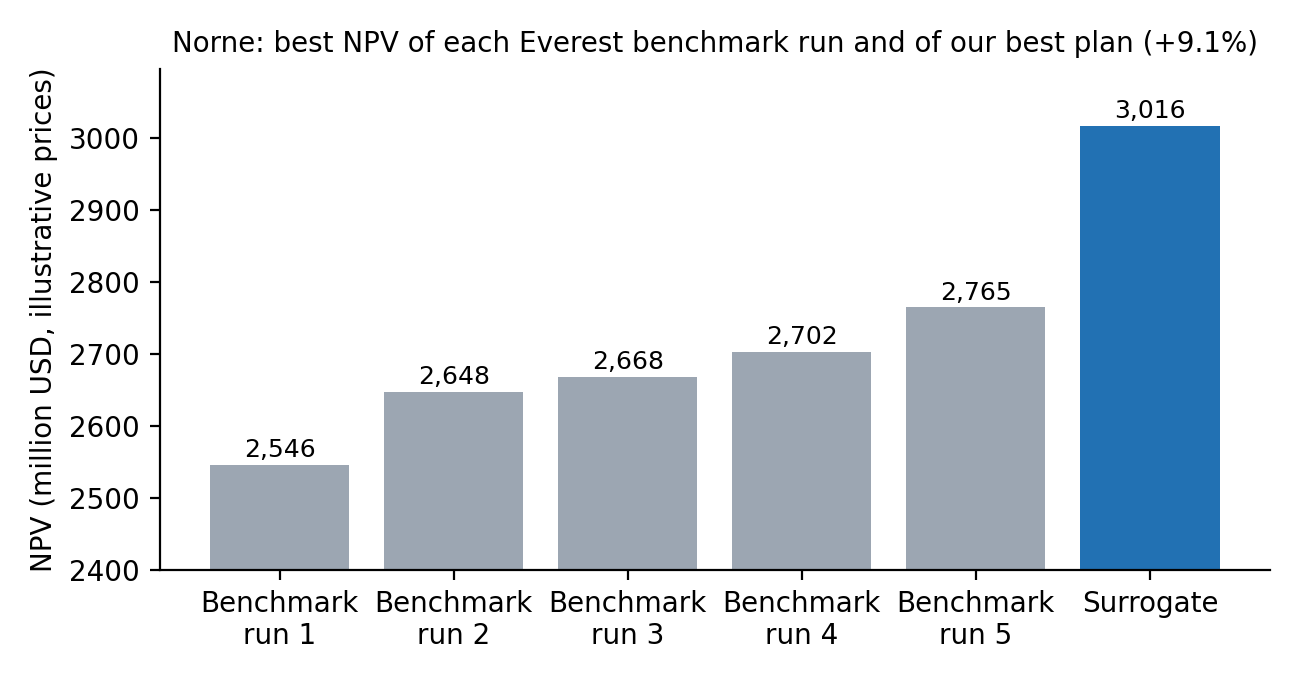
NPV of our best plan vs Everest: The best NPV of each Everest start, and the plan the surrogate found without Flow, checked in OPM Flow. Every number is an OPM Flow run.
NPV of our best plan vs Everest. The best NPV of each Everest start, and the plan the surrogate found without Flow, checked in OPM Flow. Every number is an OPM Flow run.
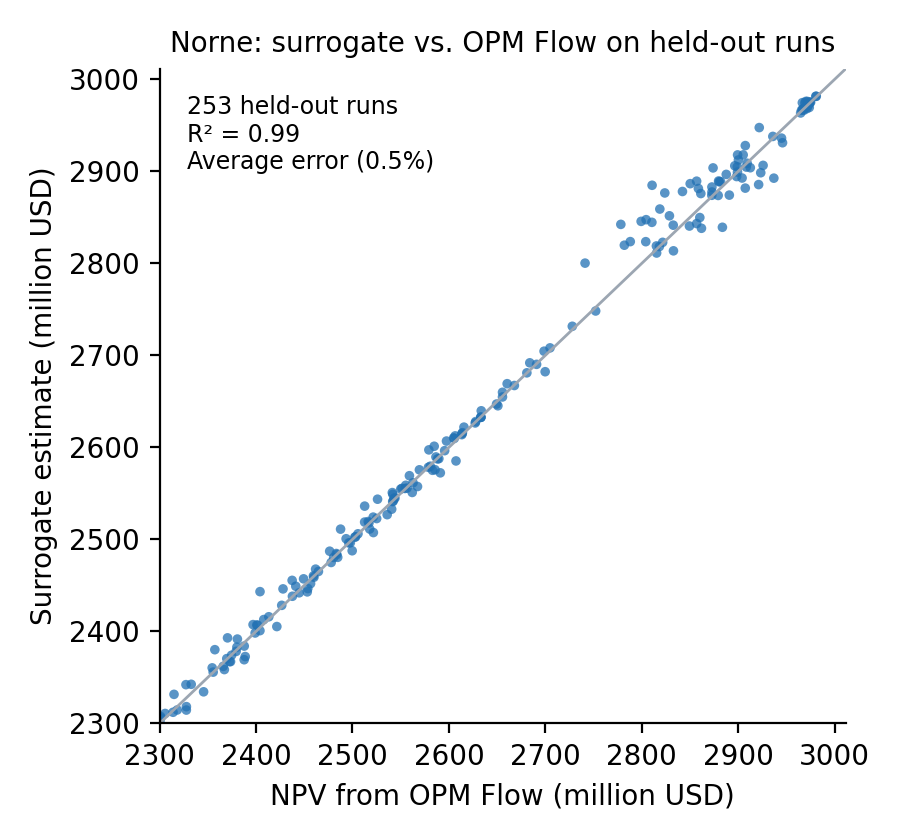
What-if accuracy: The surrogate's NPV against OPM Flow on runs it never trained on.
What-if accuracy. The surrogate's NPV against OPM Flow on runs it never trained on.
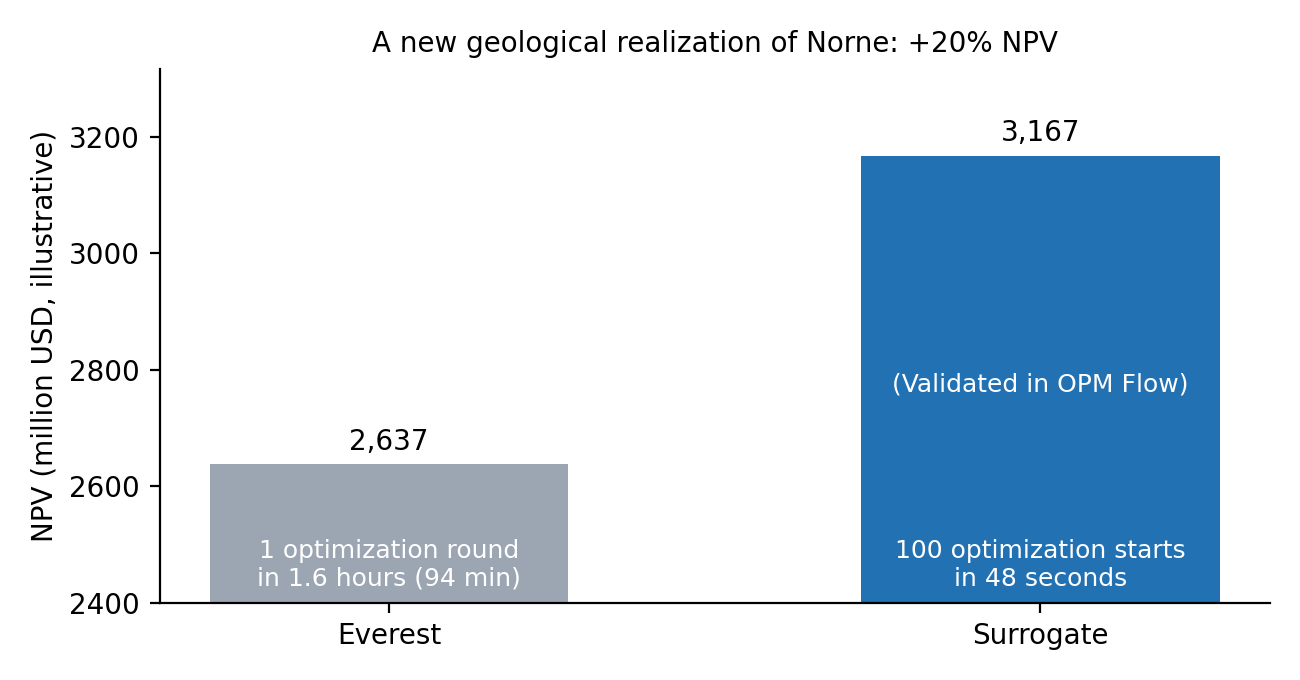
A new geology: Everest's best vs our best plan on another geological realization.
A new geology. Everest's best vs our best plan on another geological realization.
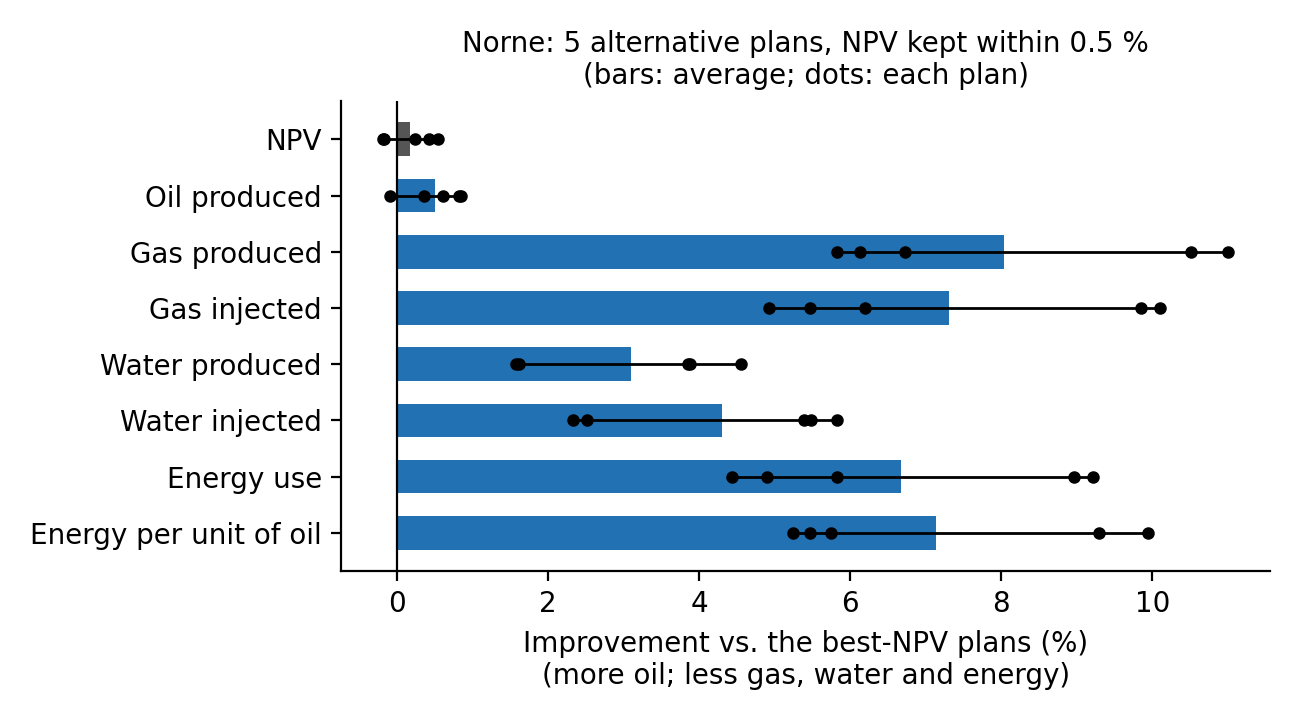
Trade-off plans: Plans that keep the best NPV and change the other objectives, checked in OPM Flow.
Trade-off plans. Plans that keep the best NPV and change the other objectives, checked in OPM Flow.
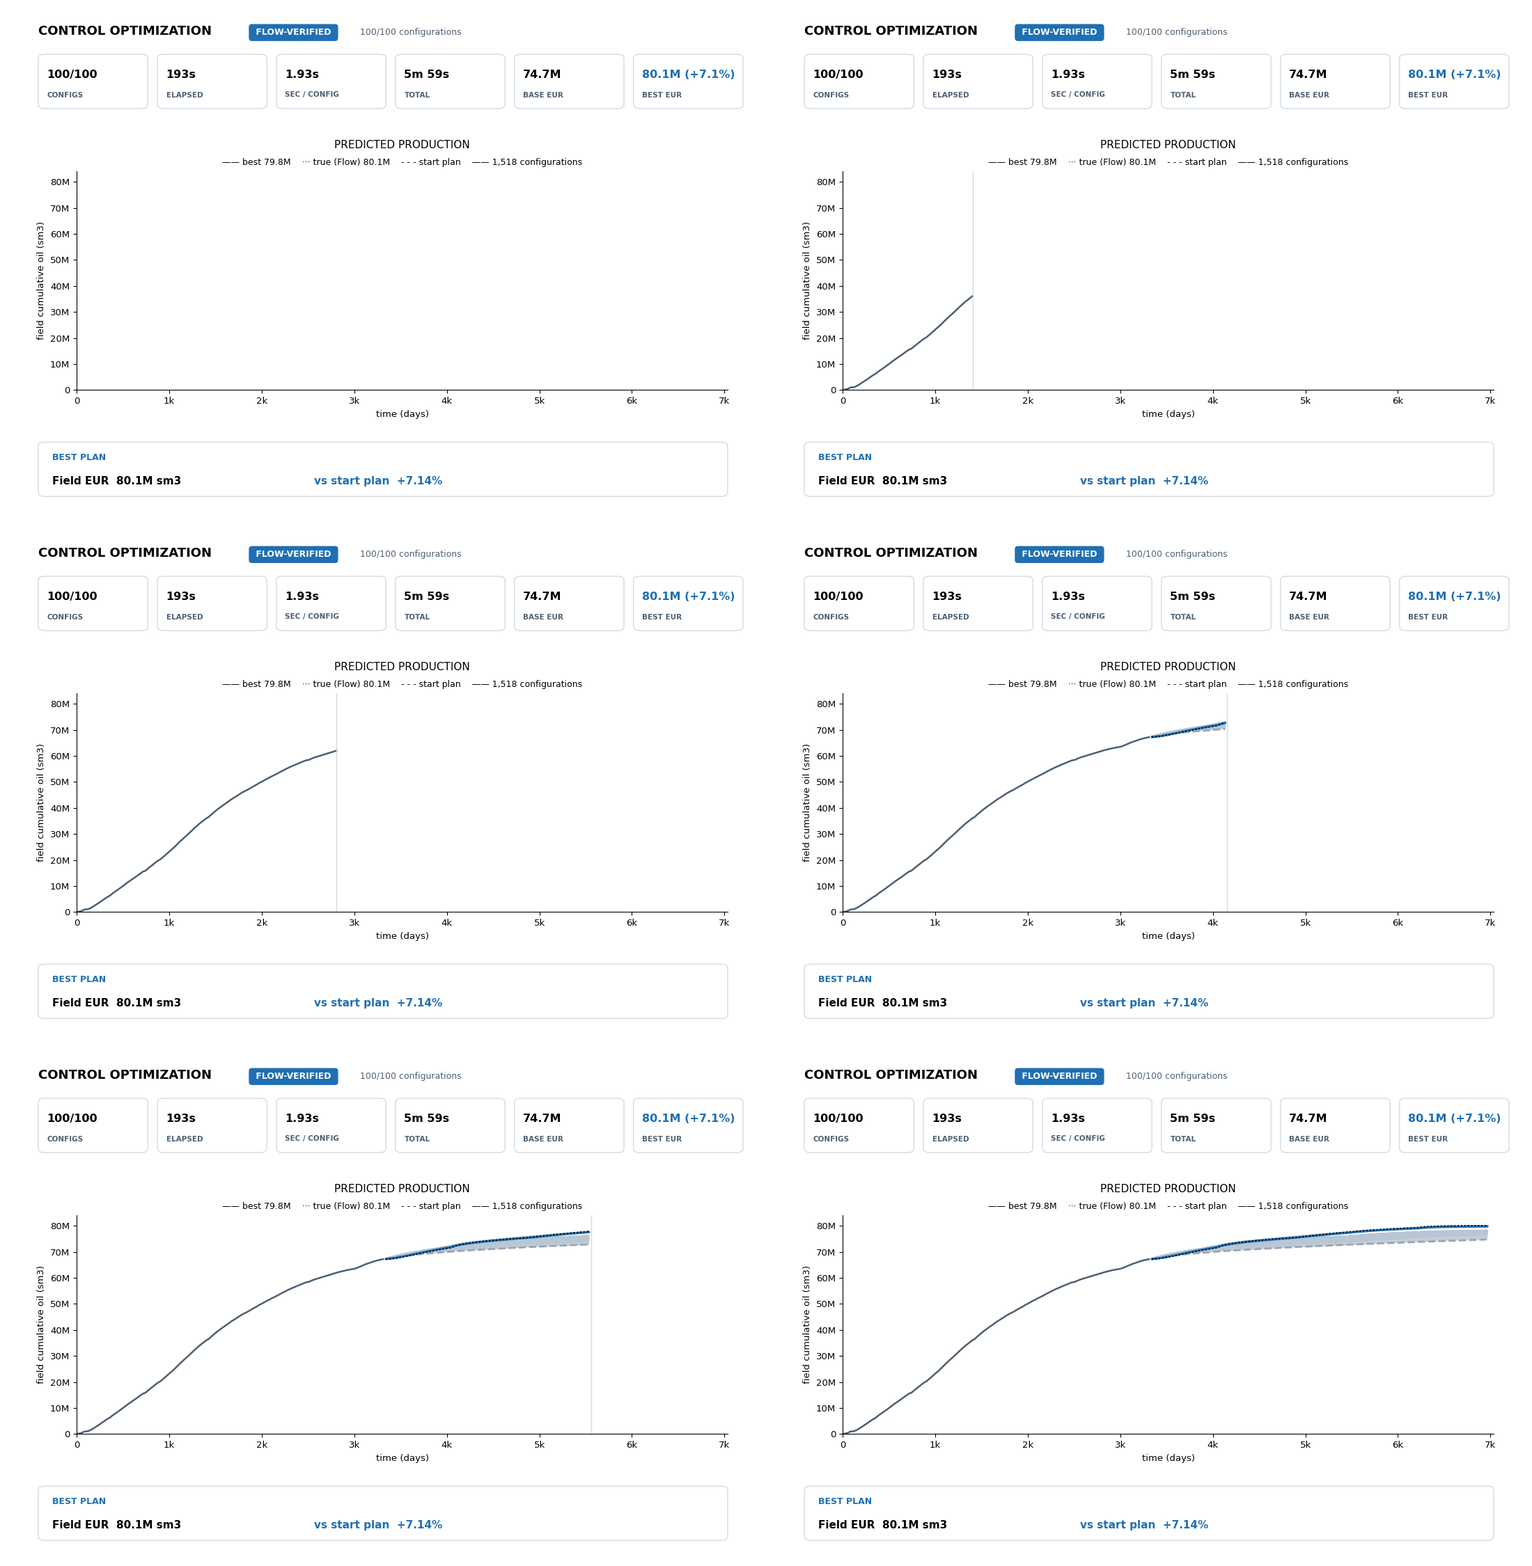
The optimization: The surrogate searches the controls without Flow; the curves are the field cumulative oil of every plan it tried, and the best plan's OPM Flow run.
The optimization. The surrogate searches the controls without Flow; the curves are the field cumulative oil of every plan it tried, and the best plan's OPM Flow run.

Try your plan

Start from one of the plans, change any control, and press Predict.
Units: Minimum BHP in bar · Gas injection rate in Sm³/day · Water injection rate in Sm³/day.

Start from: Best plan foundEverest's bestStart plan of the 188 Flow runs within 3 % of our best NPV

WellControlYear 1Year 2Year 3Year 4Year 5
B-1BH Minimum BHP60–250 bar
B-2H Minimum BHP60–250 bar
B-3H Minimum BHP60–250 bar
B-4DH Minimum BHP60–250 bar
D-1CH Minimum BHP60–250 bar
D-2H Minimum BHP60–250 bar
D-3BH Minimum BHP60–250 bar
E-1H Minimum BHP60–250 bar
E-2AH Minimum BHP60–250 bar
E-3CH Minimum BHP60–250 bar
K-3H Minimum BHP60–250 bar
C-1H Gas injection rate0–4500000 Sm³/day
C-3H Gas injection rate0–5500000 Sm³/day
C-4AH Gas injection rate0–600000 Sm³/day
F-1H Water injection rate0–17000 Sm³/day
F-2H Water injection rate0–10000 Sm³/day
ObjectiveThis plan (surrogate) Our best plan (validated)vs our best plan
NPVmillion USD, higher is better 2,981 ± 30 3,016 the same
Oil producedmillion Sm³, higher is better 12.72 ± 0.10 12.88 the same
Gas producedbillion Sm³, lower is better 32.76 ± 0.21 33.16 the same
Water producedmillion Sm³, lower is better 71.40 ± 0.73 71.45 the same
Gas injectedbillion Sm³, lower is better 26.85 ± 0.13 26.84 the same
Water injectedmillion Sm³, lower is better 55.97 ± 0.53 55.36 the same
Plateaumonths, higher is better 0.00 ± 0.33 0.00 the same
Water breakthroughmonths, higher is better 29.9 ± 6.2 0.0 the same
Energy useGWh, lower is better 3,173 ± 16 3,161 the same
Energy per unit of oilkWh per Sm³, lower is better 247.4 ± 3.2 245.4 the same

Field rates, month by month

Our best planthis plan is our best plan; change a control to compare against it

Oil rate Sm³/day
06k12k 20072009201120132015
Gas rate Sm³/day
020M40M 20072009201120132015
Water production rate Sm³/day
040k80k 20072009201120132015
Gas injection rate Sm³/day
05M10M 20072009201120132015
Water injection rate Sm³/day
012.5k25k 20072009201120132015