Case study: well control optimization on the Norne field model
Well control plans that improve NPV, water and gas handling and energy use all at once, for every realization of your field, at a fraction of the simulation effort of a conventional optimization, and every plan verified in OPM Flow. Once your field is set up, new or updated realizations are re-optimized with a small fraction of the runs a conventional optimization needs, so the study stays current as your history match changes.
For reservoir engineering and asset teams who own the development plan and its uncertainty, and for the reservoir-study consultancies who support them.
The problem
Optimizing the well controls of a full-field model is expensive. A conventional optimization needs hundreds to thousands of simulation runs for one geological realization, and returns one plan, judged by NPV alone. Repeating it for every realization of a history-matched ensemble is usually out of budget. The decisions that NPV does not capture (water handling, gas injection volumes, energy use) are left to judgment.
What we did on Norne
Norne is a Norwegian Sea oil field whose full simulation model was released publicly by Equinor and NTNU as a benchmark. We optimized the controls of its 16 active wells for the 10 years after the end of its history, and compared the result with a conventional optimization (Everest, the established open-source optimization tool) run on the same model with the same economics.
1A higher NPV than the benchmark
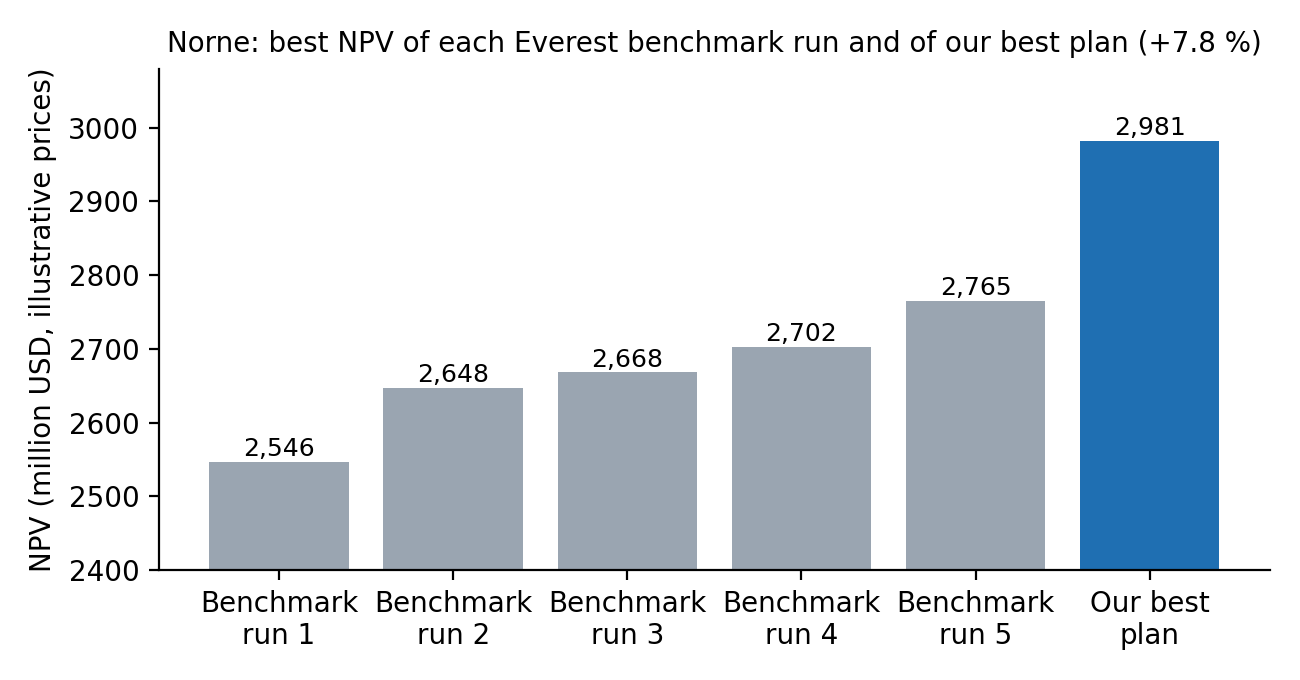
The conventional benchmark, five optimization runs from different starting points and 1,118 simulation runs in total, reached a best NPV of 2,765 million USD. Our plans reached 2,981 million USD, +7.8 %, with about 400 simulation runs, about a third of the benchmark’s.
2Several plans at the same NPV that improve everything else
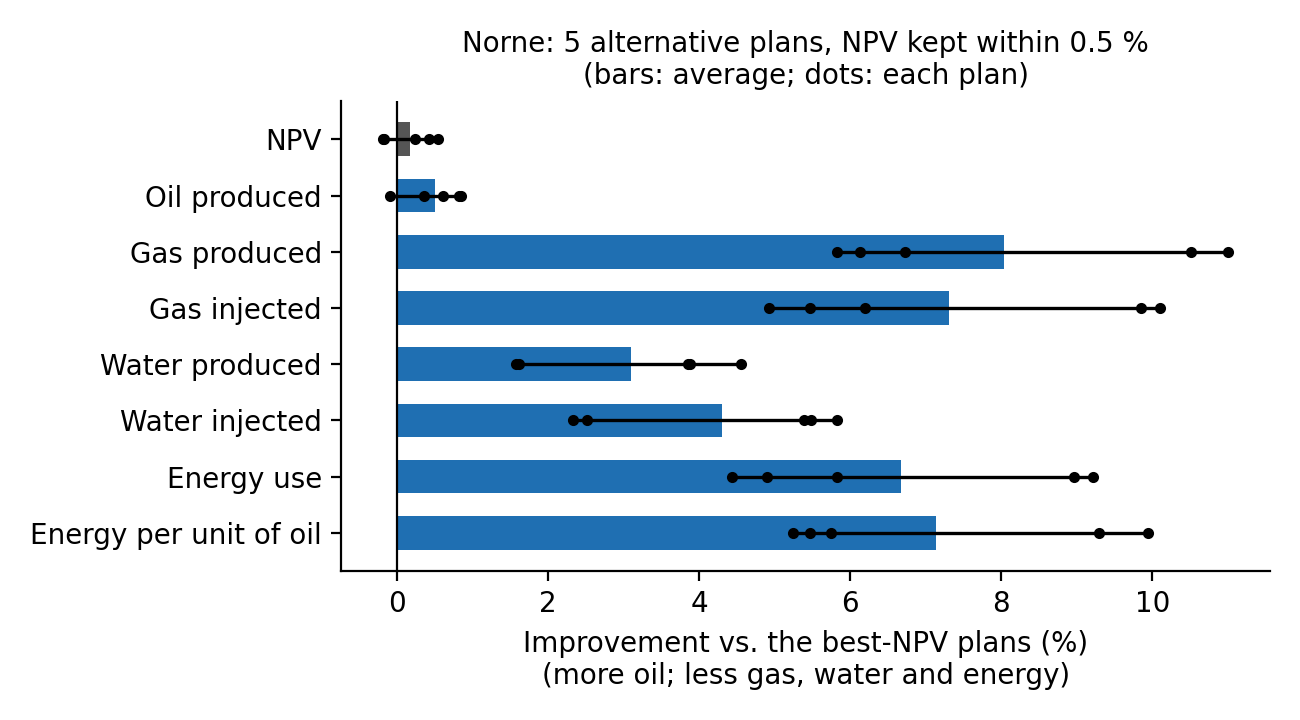
An NPV-optimal plan is rarely the only good one. From the best plans we delivered five alternative plans that keep the NPV within 0.5 % (three of them higher) and, compared with the plans they started from:
- produce 6–11 % less gas and inject 5–10 % less gas,
- produce 2–5 % less water and inject 2–6 % less water,
- use 4–9 % less energy, and
- delay field water breakthrough from the first month to month 28–32 in four of the five plans,
with about the same oil (−0.1 to +0.8 %). They let your team choose by what the NPV does not capture: facilities, operations or risk. They took 160 additional simulation runs, to verify every step in OPM Flow.
3A new geological realization, optimized with under 100 runs
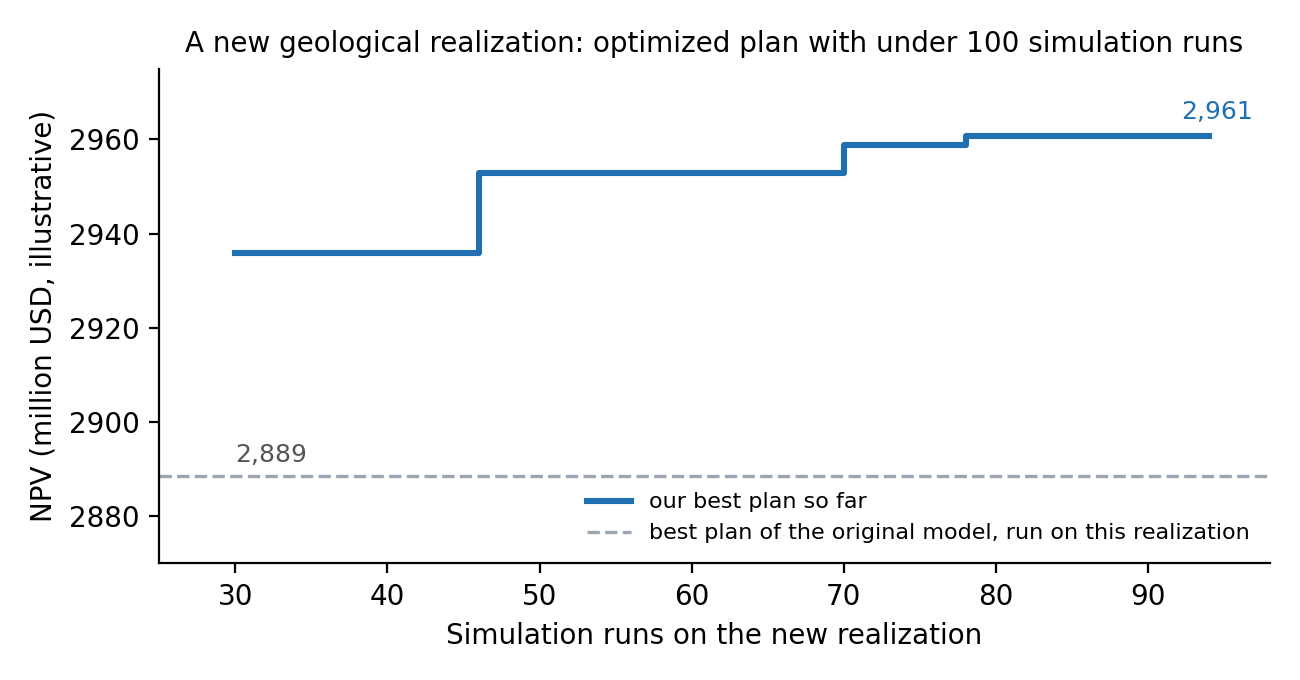
We then changed the geology: a new realization of Norne with a different permeability and porosity field. A plan that is best for one geology is not best for another: the original model’s best plan gives 2,889 million USD here. With 94 simulation runs on the new realization, less than a tenth of the benchmark’s runs on the original model, we reached a plan of 2,961 million USD. Every one of those runs is a full OPM Flow simulation.
We did not run a conventional optimization on this realization, so this is not a benchmark comparison: it shows what a new or updated realization costs once your field is set up. Studying every realization of an ensemble, and repeating the study when the history match is updated, becomes affordable.
4The uncertainty picture across an ensemble (test model)
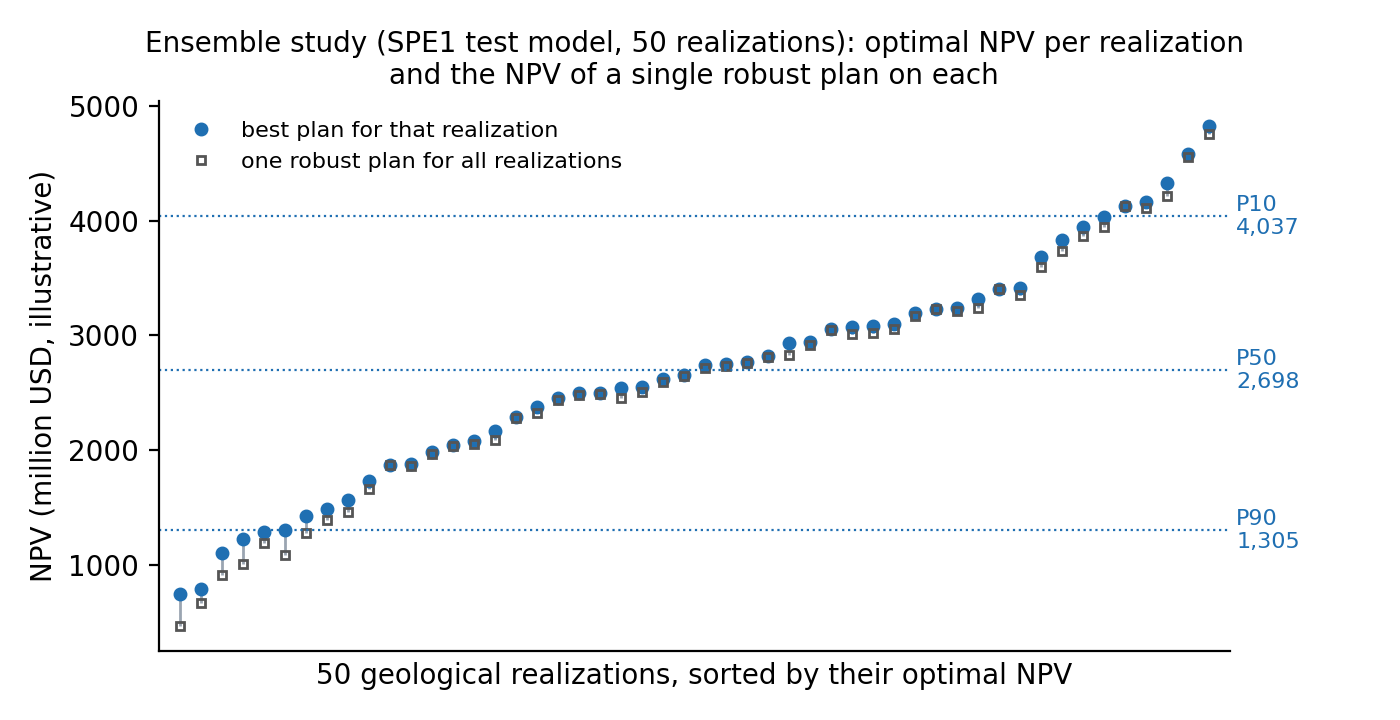
The conventional benchmark for an ensemble, an Everest optimization over all realizations at once, takes thousands of full-field simulations, too many for this case study on Norne. We therefore show the ensemble on a smaller test model (SPE1: one producer, one gas injector): a full ensemble of 50 geological realizations, with every NPV from an OPM Flow run. The test model shows what an ensemble study delivers; that our results hold on a full field is shown by the Norne results above (16 wells, 80 decisions, a new realization with under 100 runs).
Everest’s robust optimization raised the cumulative oil of the whole ensemble, both its mean and its P90–P10 range:
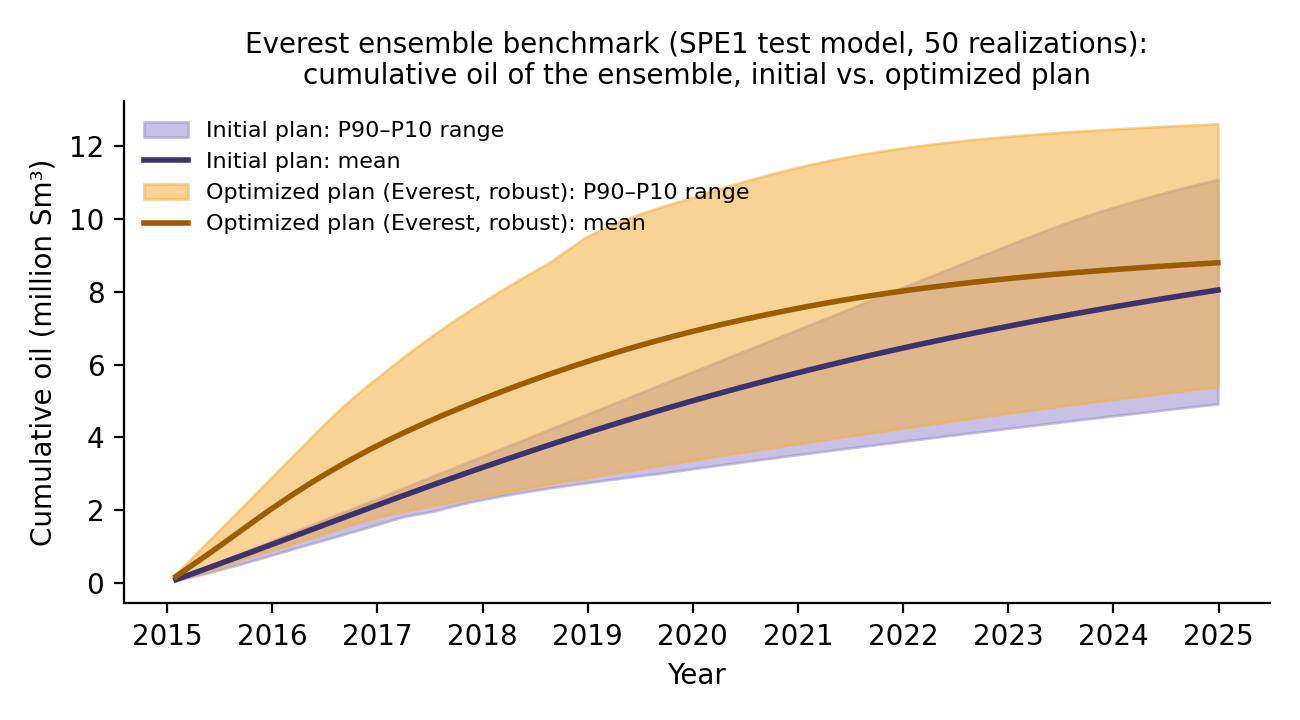
The optimal NPV ranges from 1,305 (P90) through 2,698 (P50) to 4,037 (P10) million USD: the geology moves the value far more than any plan. A single robust plan, optimized for the whole ensemble, comes within a median of 1.4 % of each realization’s own optimum, but loses more than 5 % on 9 realizations, up to 37 % on the poorest. You see both: the range of value you can expect, and where one plan for all realizations is good enough and where it is not.
On top of this conventional ensemble study, what we showed on single Norne realizations extends to every realization of your ensemble:
- A higher-NPV plan for each realization, not only one robust plan for all.
- Alternative plans for each realization that keep its NPV and reduce gas and water handling and energy use, or delay water breakthrough.
- The spread of every measure, not only NPV: P10/P50/P90 across the ensemble of the optimal NPV and of the oil, gas, water and energy of the recommended plans.
- How each realization’s best plan performs on all the others, so you see which plans are robust and which only fit one geology.
- New or updated realizations added with a small fraction of the runs a conventional optimization needs, as on the new Norne realization above.
Every one of these plans and numbers is an OPM Flow run.
What you get for your field
- A conventional benchmark you already trust. Each study starts with an Everest optimization of your model, so every delivered plan is compared with a reference your team can reproduce and audit.
- Higher-NPV plans than the benchmark, for each realization you choose.
- Several plans at the same NPV that reduce water and gas handling and energy use, or delay breakthrough, so you can choose by what the NPV does not capture.
- Every realization optimized, not only one, with a small fraction of the simulation runs a conventional optimization needs, and repeatable when the history match is updated.
- The uncertainty picture: P10/P50/P90 of the optimal NPV and of each production and operating measure across your ensemble, how each realization’s best plan performs on the others, and plans that hold up across the realizations you trust.
- Numbers you can defend: every plan, NPV and production profile you receive is an OPM Flow run, as is every result reported in sections 1–4. None of them is a model estimate.
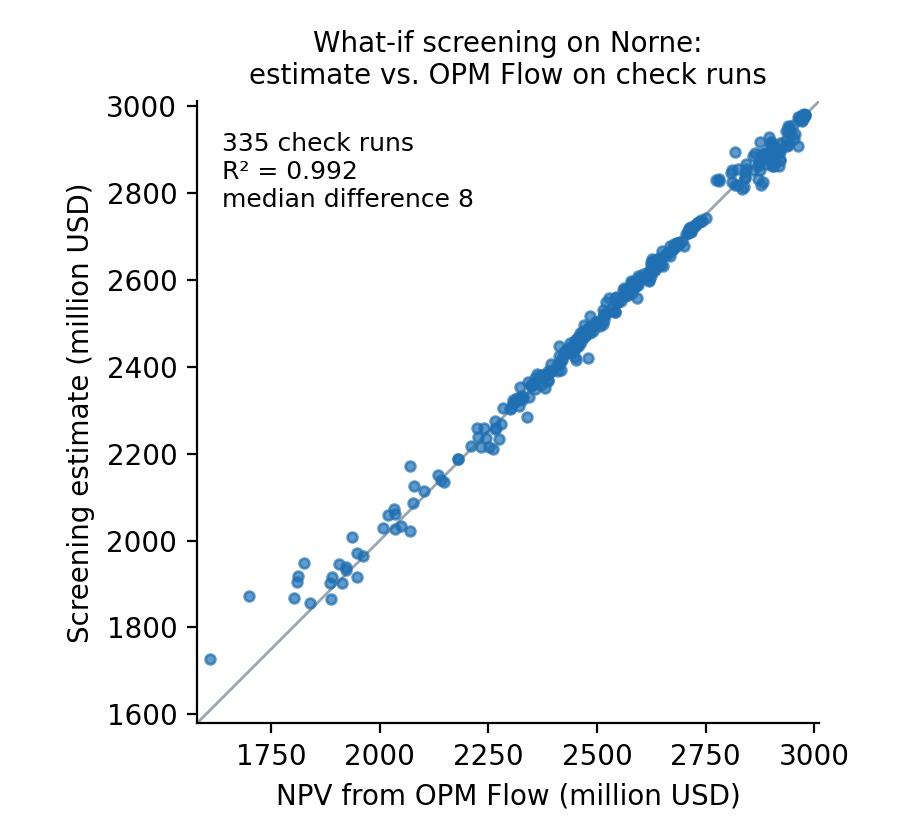
- What-if screening: send us any schedule, including your current plan, and we return its expected NPV, oil, gas, water and energy, computed by our surrogate in seconds; the plans you decide on are confirmed in OPM Flow.
How close the screening estimates are: we set aside 335 OPM Flow runs on Norne as a check and never used them to fit the estimates. On these runs, the median difference between the estimated and the simulated NPV is 8 million USD (about 0.3 % of the NPV).
Norne is a public model, so every result in this case study can be reproduced.
Scope of this phase: OPM Flow models; continuous rate and bottom-hole pressure schedules for existing producers and injectors in black-oil fields under depletion, waterflood or gas injection.
Assumptions of this case study
- Model: the public Norne full-field model (Equinor and NTNU), restarted at the end of its history (1 Dec 2006); prediction period 2007–2016, monthly reporting; OPM Flow.
- Decisions: the 11 producers and 5 injectors (3 gas, 2 water) active at the end of the history, one setting per well per 2-year period: producer minimum bottom-hole pressure (60–250 bar) and injection rate (within each well’s range).
- Economics (illustrative, not Norne’s actual economics): oil 377 USD/Sm³ (≈ 60 USD/bbl), produced gas 0.10 USD/Sm³, produced water −6 USD/Sm³, injected gas −0.12 USD/Sm³, injected water −6 USD/Sm³; 8 % per year discount, applied monthly; no capital or well costs. The absolute NPVs depend on these prices; the relative improvements are the result.
- Other measures: energy from 0.1 kWh/Sm³ of gas injected, 1 kWh/Sm³ of water injected and 5 kWh/Sm³ of liquid produced (illustrative); water breakthrough is the month the field water cut first exceeds its starting level by 0.1.
- New realization: the Norne model with a randomly perturbed permeability and porosity field, its history rerun; all other data unchanged.
- Ensemble test model: the SPE1 benchmark model (one producer, one gas injector), 50 realizations with randomly sampled permeability and porosity; 10 years; the same illustrative prices and discounting; 5 settings per 2-year period (producer oil and gas rate limits and minimum bottom-hole pressure, injector rate and maximum bottom-hole pressure).
To discuss your field
Ardavan Borzou, PhD, CompuFlair
support@compu-flair.com